
Infographic Posters
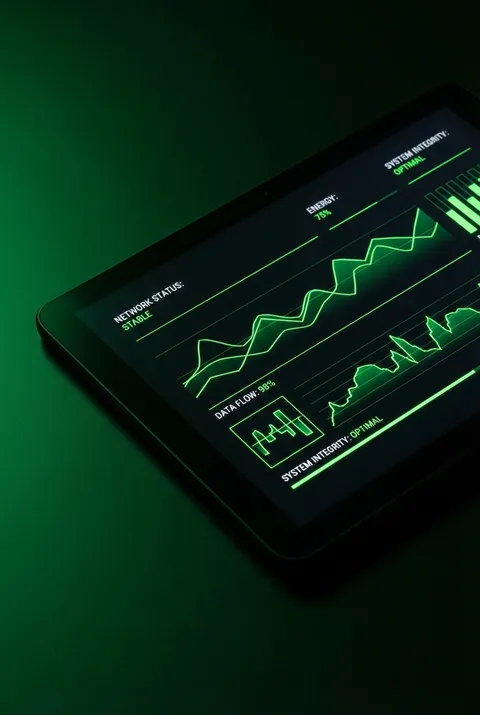
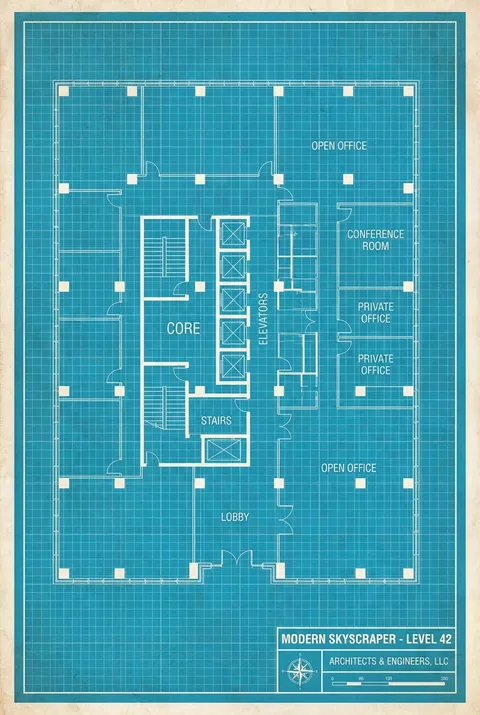
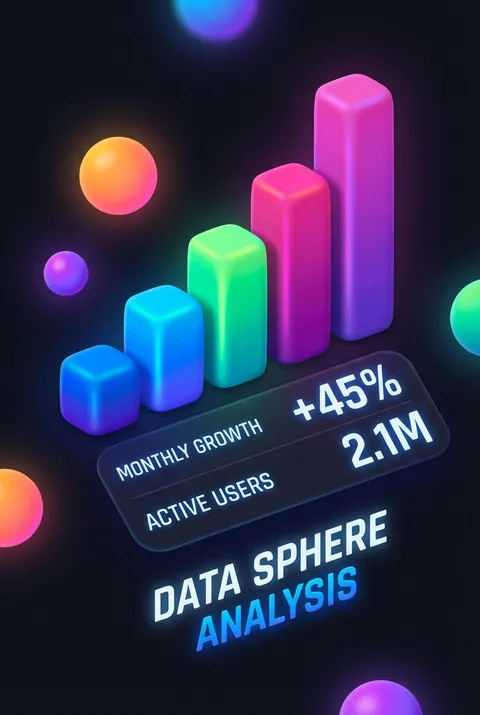
Infographic posters that turn data into charts, timelines, and icons. Useful for reports, classrooms, and public awareness.
5 credits for new user registration. No credit card required.
Create Your Own Infographic Poster
Use our AI generator to design Infographic posters in seconds with full commercial rights.
Create Infographic Poster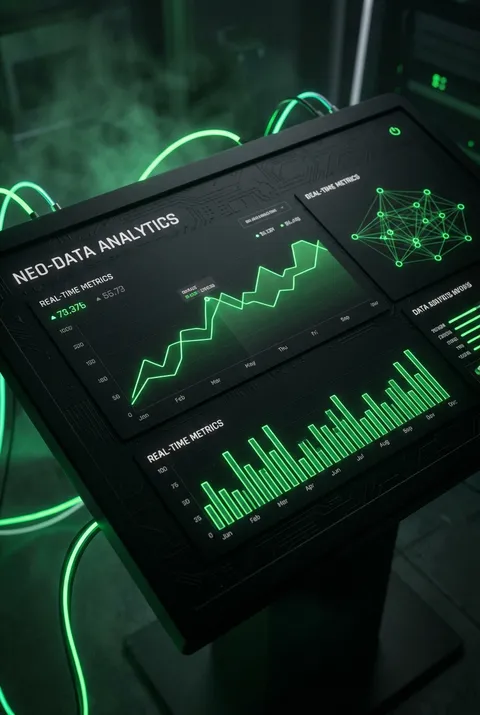


The Art of Infographic?
Watch: Creating a Poster in 30s
Turn Ideas into Art in Seconds
Describe Your Vision
Simply type your idea or concept for the poster.
Select Infographic Style
Our AI applies the specific Infographic design rules to your concept.
Customize & Download
Fine-tune colors, add text, and export in high-resolution.
Why Designers Choose Us
The professional choice for AI-generated design
Instant Speed
Results in < 30s
CC0 License
100% Commercial Use
Fully Editable
Layer-by-layer control
High Res
Print-ready quality
About Infographic Design
Infographic Poster Design - Data Visualization & Information Graphics
Related Keywords
Infographic FAQ
Quick answers about designing Infographic posters.
What is the difference between infographics and data visualization?
Data visualization focuses on accurately representing numbers through charts and graphs. Infographics combine data visualization with narrative design—adding context, icons, and visual flow to tell a complete story. The best infographic posters use both to inform and engage.
How do I create an effective infographic?
Start with a clear message and supporting data points. Organize information in a logical flow—typically top to bottom or left to right. Use consistent visual language: one icon style, limited color palette, unified typography. Balance data richness with visual clarity.
What tools can I use for infographic design?
AI infographic generators offer templates with pre-built chart components, icon libraries, and data input fields. They handle layout and styling automatically, letting you focus on data accuracy and narrative structure. Export in print or digital formats as needed.
What makes infographic posters shareable?
Surprising statistics, clear takeaways, and visually striking design encourage sharing. Create infographics that tell a complete story in one glance. Include your branding subtly—shared infographics become marketing assets.
Ready to design your next poster?
Create Infographic Poster